Early detection of severe cases due to sepsis in Emergency Department in in the era of New Diagnostic Criteria: preliminary data from an Italian “real life” study

Sozio Emanuela1, Tarabori Serena2, Bertolino Giacomo3, Carfagna Fabio 4, Novelli Francesca2, Di Paco Irene 1, Tascini Carlo5, Santini Massimo6, Ghiadoni Lorenzo2, Bertini Alessio1

  1. Emergency Department , North-West District, Tuscany Health Care, Spedali Riuniti Livorno, Leghorn, Italy
  2. Emergency Medicine Unit, Nuovo Santa Chiara University Hospital, Azienda Ospedaliera Universitaria Pisana, Pisa, Italy
  3. Department of Public Health, Clinical and Molecular Medicine, Università degli studi di Cagliari, Italy
  4. Azienda Ospedaliero Universitaria Maggiore della Carità, Novara, Italy 
  5. First Division of Infectious Diseases, Cotugno Hospital, Azienda Ospedaliera dei Colli, Naples, Italy
  6. Emergency Department, Nuovo Santa Chiara University Hospital, Azienda Ospedaliera Universitaria Pisana, Pisa, Italy

Abstract

Background
Early recognition is a key point of management of sepsis because it allows a timely treatment. The aim of this study was to discover which clinical signs are able to identify patients at risk of death due to sepsis in Emergency Department (ED).
 
Methods
349 patients with diagnosis of infection with or without clinical criteria of sepsis or septic shock, according to the new definitions (Sepsis -3), were enrolled.
 
Results
Clinical signs resulted able to identify patients who are at risk of death due to sepsis,with acceptable performing result (AUROC values ≥ 0.70), were lactate values, MEWS and shock index.
 
Conclusion
Lactates value and clinical tools such as MEWS or shock index, could be already used in the triage phase to identify patients at risk of poor prognosis due to sepsis.

Keywords

Sepsis-3; Sepsis; Septic shock; qSOFA; MEWS

Abbreviations

COPD = Chronic obstructive pulmonary disease 
CVC= Central Venous Catheter 
ED = Emergency Department 
GCS = Glasgow Coma Scale
ICD-9 = Codes for International Statistical Classification of Diseases and Related Health Problems
ICU = Intensive Care Unit
MAP= Mean arterial pressure
MEWS = Modified Early Warning Score 
PCT = Procalcitonin
qSOFA = Quick Sequential Organ Failure Assessment 
SIRS = Systemic Infiammatory Response Syndrome
SOFA = Sequential Organ Failure Assessment
SSC = Surviving Sepsis Campaign
WBC = White Blood Cells

Introduction

Early recognition is a key point of the entire management of sepsis because it allows a timely treatment and this improves survival12. Worldwide estimated incidence is 270 cases per 100,000 inhabitants/year and the mortality rate ranges between 20 and 40%3.

In 2016 a new definition of sepsis was proposed: SIRS-related criteria were abandoned while SOFA and qSOFA scores were proposed as diagnostic and early recognition tools, respectively. In this way the management protocol of sepsis is simpler and would allow an early recognition4.
In Italy, if we exclude some regional initiatives, there are few documents that define an optimal management of the septic patient. Recently, SIMEU’s Consensus on Sepsis has been published with the aim of providing guidelines for emergency department – ED5
After Sepsis -3, a lot of retrospective and meta-analysis studies were performed to compare the performance of qSOFA, for example, with the SIRS criteria, and the role of qSOFA was strongly reduced considering the non-conclusive results.
Singer et al showed that qSOFA plays a role in predicting mortality and the need for Intensive Care Unit – ICU – transfer6, as well as Freund et al demonstrated in a prospective study that qSOFA  predicts mortality better than  SIRS criteria and old definitions of severe sepsis7. Serafim meta-analysis concludes that the SIRS criteria are more sensitive for the diagnosis of sepsis while qSOFA is superior in predicting mortality8.
Recent literature reveals the difficulty in indicating validated criteria for the early recognition of sepsis in ED, currently lacking sufficient valid data to give definitive indication5: combined use of objectifiable variables in Triage phase remains the most indicated element.
The Tuscan region has proposed the use of Modified Early Warning Score – MEWS, while Friuli Venezia Giulia has proposed the combined use of qSOFA and data such as heart rate, oxygen saturation, anuria, and signs of hypoperfusion9,10
The purpose of this study was to find out which clinical signs allow to identify in a few minutes patients who are at risk of death due to sepsis, so that necessary diagnostic and therapeutic measures can be promptly taken and any transfer to ICU can be taken into consideration.

Methods

This real-life prospective study enrolled 349 patients admitted to the ED of Pisa Hospital from 1 March 2017 to 31 May 2018 with diagnosis of infection with or without clinical criteria of sepsis or septic shock, according to the new definitions of sepsis and septic shock (Sepsis -3). Cases were identified through the ICD-9-CM codes and the ED discharge diagnosis of sepsis, severe sepsis or septic shock. The definition was different because the new one had not been introduced in (the) daily clinical practice yet.

For each patient were investigated: demographic data (sex, age, and patient’s provenience); comorbidities (Charlson Comorbidity Index – CCI, end-stage renal failure, chronic liver diseases, Chronic Obstructive Pulmonary Disease – COPD, tumors, immunodepression/immunosuppression as HIV,  oncohematological  neutropenia, chemotherapy and radiotherapy, immunomodulatory therapies) and other risk factors (30-days previous surgery, 30-days previous trauma exposure, 30-days previous antimicrobial treatments, corticosteroid treatments, intracardiac devices and vascular or osteo-articular prostheses, presence of biomedical device such as Central Venous Catheter – CVC – or Bladder Catheter at admission); clinical manifestations and tools that could also be used directly in patient’s triage phase (Fever, Sequential Organ Failure Assessment score value – SOFA, quick SOFA – qSOFA, Systemic Inflammatory Response Syndrome Criteria – SIRS, Glasgow Coma Scale – GCS, vital signs, Modified Early Warning Score for Clinical Deterioration – MEWS – and Shock Index),  blood tests (white blood cells count – WBC, platelets, plasmatic creatinine value, lactate level measured in the arterial blood gas, procalcitonin value – PCT, bilirubin value), therapies undertaken or administered, data  concerning hospitalization (length of stay, admission in Intensive Care Unit – ICU) and clinical outcome (overall mortality, mortality in ED, mortality during hospital stay and within 14 days). 
Data shown in this study are preliminary data taken from a series of cases still ongoing.
The aim of the study was to perform an analysis related to in-hospital mortality in the overall population and understand how quickly these cases were recognized and therefore managed in ED. A comparison between infected patients who have not developed sepsis nor septic shock and cases of sepsis or septic shock, diagnosed according to the new definitions of sepsis and septic shock (Sepsis – 3), was done.
Statistical Analysis
 
Descriptive analysis of the data was carried out using median values and the interquartile range for the quantitative variables and percentage values for the qualitative ones. The normality of frequency distributions of quantitative variables was tested using the Shapiro-Wilk test and values of asymmetry and kurtosis related to their standard error.
Association between endpoint variables and explicative variables was verified with a nonparametric approach using the chi-square test and the Mann-Whitney test.
In order to quantify the strength of the association crude Odds Ratio and the corresponding confidence intervals were calculated. Receiver operating characteristics (ROC) analysis was carried out and area under the ROC curve (AUROC) was compared to evaluate the predicting ability of those variables that can be easily and quickly applied in ED to identify patients at risk to die because of sepsis.
A p value <0.05 was considered statistically significant. All analyzes were conducted using the SPSS statistical package (version 23 for Windows. SPSS, Inc. Chicago, Ill).


Results

Among the 349 cases enrolled, patients with sepsis and/or septic shock were identified according to the new definitions of sepsis and septic shock (Sepsis – 3). According to Sepsis-3 definition, at the moment of admission in ED 54 patients (15.4%) had only an infection in absence of sepsis or septic shock while 295 patients (84.5 %) met sepsis and septic shock criteria. 
Results from a comparison between 54 infected cases and 295 cases that met criteria of sepsis or septic shock are summarized in Table 1.


Overall population

Infections without sepsis or septic shock criteria

Sepsis or septic shock criteria

p-value

(n = 349)

(n = 54)

(n = 295)

Age

80.0 (71.0 – 87.0)

76.0 (65.0 – 85.0)

81.0 (72.0 – 87.0)

p = 0.023

Male sex

211 (60%)

36 (67%)

175 (59%)

p = 0.388

Diabetes

87 (25%)

17 (31%)

70 (24%)

p = 0.298

CCI

2.0 (1.0 – 4.0)

3.0 (2.0 – 5.0)

2.0 (1.0 – 4.0)

p = 0.015

qSOFA

86/316 (27%)

2/52 (4%)

84/264 (32%)

p < 0.001

SOFA score

4.0 (3.0 – 6.0)

3.0 (1.0 – 4.0)

4.0 (3.0 – 6.0)

p < 0.001

GCS

15.0 (13.0 – 15.0)

15.0 (15.0 – 15.0)

15.0 (11.0 – 15.0)

p < 0.001

MEWS

2.0 (1.0 – 4.0)

1.0 (0.0 – 2.0)

3.0 (1.0 – 5.0)

p < 0.001

Shock Index

0.8 (0.7 – 1.1)

0.7 (0.6 – 0.8)

0.8 (0.7 – 1.1)

p = 0.001

End-stage renal failure

11 (3%)

3 (6%)

8 (3%)

p = 0.396

Chronic Liver diseases

19 (5%)

5 (9%)

14 (5%)

p = 0.309

COPD

44 (13%)

13 (24%)

31 (11%)

p = 0.011

Tumors

68 (19%)

18 (33%)

50 (17%)

p = 0.009

Immunodepression / immunosuppresion

35 (10%)

8 (15%)

27 (9%)

p = 0.304

Previous surgery 

32 (9%)

6 (11%)

26 (9%)

p = 0.778

Previous trauma exposure 

22 (6%)

3 (6%)

19 (6%)

p = 1.000

Previous antimicrobial treatments 

126/343 (37%)

22/53 (42%)

104/290 (36%)

p = 0.529

Corticosteroid treatments

62 (18%)

12 (22%)

50 (17%)

p = 0.460

Prostheses

57 (16%)

13 (24%)

44 (15%)

p = 0.141

CVC

38 (11%)

5 (9%)

33 (11%)

p = 0.857

Bladder Catheter

57 (16.3%)

5 (9.3%)

52 (17.8%)

p = 0.120

SIRS criteria

233 (67%)

30 (56%)

203 (69%)

p = 0.081

Hospitalization

331 (95%)

52 (96%)

279 (95%)

p = 0.849

ICU

30 (9%)

2 (4%)

28 (9%)

p = 0.258

Overall mortality

76 (22%)

4 (7%)

72 (24%)

p = 0.009

In-emergency department mortality

14 (4%)

0 (0%)

14 (5%)

p = 0.126

In-Hospital mortality

62/331 (19%)

4/52 (8%)

58/279 (21%)

p = 0.042

Discharge a home

4 (1%)

2 (4%)

2 (1%)

p = 0.130

Length of hospital stay (days)

7.0 (4.0 – 10.0)

6.5 (5.0 – 12.0)

7.0 (4.0 – 10.0)

p = 0.213

MAP

132.7 (113.3 – 156.7)

139.7 (122.7 – 162.0)

128.3 (111.7 – 156.7)

p = 0.041

Hypotension

101/313 (32%)

7/50 (14%)

94/263 (36%)

p = 0.004

Body Temperature (°C)

37.6 (36.7 – 38.5)

37.6 (36.5 – 38.1)

37.6 (36.7 – 38.5)

p = 0.285

WBC 103

13.9 (9.4 – 20.8)

13.9 (10.0 – 20.1)

13.8 (9.3 – 21.1)

p = 0.865

Platelets 106

190.0 (126.0 – 276.0)

217.0 (170.0 – 289.0)

184.0 (123.0 – 273.0)

p = 0.058

Plasmatic creatinine     

value (mg/dl)

1.4 (0.9 – 2.2)

1.2 (0.9 – 2.1)

1.4 (1.0 – 2.3)

p = 0.130

Lactate value (mmol/l)

1.8 (1.1 – 3.3)

1.0 (0.8 – 1.2)

2.1 (1.2 – 3.6)

p < 0.001

PCT value (pg/ml)

2.3 (0.6 – 11.2)

1.0 (0.4 – 4.4)

2.7 (0.7 – 12.4)

p = 0.010

Bilirubin value (mg/dl)

0.6 (0.4 – 1.1)

0.5 (0.3 – 0.7)

0.7 (0.4 – 1.2)

p = 0.006

Blood cultures

128/314 (41%)

22/52 (42%)

106/262 (40%)

p = 0.925

Intravenous fluids

303 (87%)

46 (85%)

257 (87%)

p = 0.867

Antibiotic therapy BEFORE sampling blood cultures

89/126 (71%)

17/23 (74%)

72/103 (70%)

p = 0.898

Empiric antibiotic therapy

249/343 (73%)

38/53 (72%)

211/290 (73%)

p = 1.000

 
Table 1 – Characteristics of overall population and comparison between 54 cases of infections without sepsis or septic shock criteria and 295 cases of sepsis or septic shock, according new definitions of sepsis and septic shock (Sepsis -3). P value <0.05 indicates a significant difference between infections and sepsis or septic shock
 
Comparing cases with sepsis and septic shock with infected patients we can see that (see Table 1): patients with infection only were older (81 vs 76 in infections, p = 0.023) but they had less comorbidities (CCI 2 vs 3, p = 0.015, COPD 11% vs 24% p = 0.011, Tumors 17% vs 33% p = 0.009); the presence of qSOFA criteria (32% vs 4%, p <0.001), a higher value of SOFA score (4 vs 3, p <0.001), MEWS score (3 vs 1, p <0.001) and Shock index (0.8 vs. 0.7, p <0.001), and a lower value of GCS (p <0.001) and MAP (p = 0.041) were more frequent in cases of sepsis and septic shock as well as hypotension (36% vs 14%, p = 0.004), a higher value of PCT (2.7 pg/ml vs 1.0 pg/ml, p = 0.010) bilirubin (0.7 mg/dl vs 0.5 mg/dl, p = 0.006), and lactate (2.1 mmol/L vs 1.0 mmol/L, p <0.001); septic patients  showed higher overall mortality (24% vs 7%, p = 0.009) and in-hospital mortality (21% vs 8%, p = 0.042) rates. Deceased patients had a median survival of 4.70 ± 5.45 days; 94.7% of them (74/76 cases) died within 14 days from hospitalization.
Ofallthe 349 cases enrolled in this study, 4 were discharged at home directly from ED (1%), 14 died in ED (4%), while the remaining 331 (95%) were hospitalized.
A set of blood cultures was collected in 128/314 patients (41%), but 71% of them were not collected prior to the administration ofanempiric antibiotic therapy.
Empiric antibiotic therapy was administered to 249/343 cases (73%) as monotherapy in 236/249 of cases (95%). Antibiotics mostly used in ED of Pisa Hospital were: piperacillin plus tazobactam (146 cases, 58.6%), cephalosporins (56 cases, 22.4%), fluoroquinolones (37 cases, 14.8%), carbapenems (6 cases, 2.4%), lycopeptides (5 cases, 2%), and macrolides (4 cases, 1.6%).
To better understand which patients wereat risk of death and to identify which clinical indicators could be used directly in ED to identify patients at risk, we made some evaluations related to in-hospital mortality.
Results from comparison between survivors (n = 273/349, 78.2%) and cases that died during hospital stay or in ED (n = 76/349, 21.7%) are summarized in Table 2.


Qualitative variables

Survivors 

(n=273)

Overall mortality  

(n=76)

*p value

chi square or fisherF’s test

n.

%

n.

%

Male Sex

169

61.9%

42

55.3%

0.295

End-stage renal failure

9

3.3%

2

2.6%

1.000

Cardiovascular diseases

125

45.8%

42

55.3%

0.144

COPD

31

11.4%

13

17.1%

0.182

Diabetes

69

25.3%

18

23.7%

0.777

Chronic Liver diseases

17

6.2%

2

2.6%

0.389

Immunodepression/

immunosuppression

26

9.5%

9

11.8%

0.552

Tumors

59

21.6%

9

11.8%

0.057

Previous Corticosteroid treatments

43

15.8%

19

25.0%

0.062

Previous trauma exposure

18

6.6%

4

5.3%

0.795

Previous surgery

25

9.2%

7

9.2%

0.989

CVC 

28

10.3%

10

13.2%

0.473

Bladder Catheter

41

15.0%

16

21.1%

0.208

Prostheses

49

17.9%

8

10.5%

0.122

Altered mental status

61

22.3%

43

56.6%

<0.001

Hypotension

67

27.6%

34

48.6%

0.001

PAM <=70

4

1.6%

2

2.9%

0.619

Hypothermia or Hyperthermia

97

39.0%

14

22.2%

0.013

Lactate > 1.8 mmol/L

118

43.7%

62

83.8%

<0.001

Leukocytosis or leukopenia

177

65.3%

54

73.0%

0.214

PCT ≥ 0.5 pg/ml

202

76.8%

63

88.7%

0.028

Creatinine ≥ 1.2 mg/dl

153

56.5%

54

74.0%

0.007

Bilirubin ≥ 1.2 mg/dl

34

18.6%

15

32.6%

0.038

PLT ≤ 106

97

35.8%

25

33.8%

0.749

qSOFA criteria

48

19.3%

38

56.7%

<0.001

SIRS criteria 

176

64.5%

57

75.0%

0.085

MEWS ≥ 5

49

17.9%

35

46.1%

<0.001

Shock index ≥ 0.7

162

67.8%

56

81.2%

0.031


Quantitative variables

Survived

Dead

*p value

Mann-Whitney Test

Median

25-75 Percentile

Median

25-75 Percentile

Age

79.0

[70 – 86]

84.0

[73.5 – 90]

0.013

CCI

2.0

[1 – 4]

3.0

[1 – 4]

0.366

GCS 

15.0

[14 – 15]

10.5

[6 – 15]

<0.001

MAP

136.67

[115 – 160]

120.00

[103 – 140]

0.001

Body Temperature (°C)

37.8

[36.8 – 38.5]

37.0

[36.0 – 38]

0.001

Lactate value (mmol/l)

1.6

[1.0 – 2.7]

3.9

[2.0 – 6.6]

<0.001

WBC 103

13.49

[9.27 – 19.75]

15.91

[9.43 – 24.92]

0.072

PCT (pg/ml)

2.0

[0.5 – 10.6]

3.0

[1.2 – 16.8]

0.038

Plasmatic creatinine (mg/dl)

1.3

[0.9 – 1.9]

2.0

[1.1 – 3.5]

<0.001

Bilirubin (mg/dl)

0.59

[0.38 – 1.00]

0.96

[0.47 – 1.60]

0.005

Platelets 106

186.0

[128.0- 274.0]

195.5

[109 – 292]

0.942

SOFA SCORE

4.0

[3.0 – 5.0]

6.0

[4.0 – 9.0]

<0.001

MEWS

2.0

[1.0 – 4.0]

4.0

[2.5 – 6.0]

<0.001

Shock index

0.77

[0.65 – 0.98]

0.98

[0.77 – 1.29]

<0.001

 
Table 2 – Comparison between 273 survivors and 76 cases that die in ED or during the hospital stay (overall mortality). P value <0.05 indicates a significant difference
 
Comparison between death and survivors shown that patients at risk to die are older (84 years vs 79 years, p = 0.013) and have (see Table 2): an altered mental status (56.6% vs 22.3%, p <0.001) with lower GCS (10.5 vs 15, p <0.001); higher incidence of hypotension (48.6% vs 27.6%,p = 0.001) with lower MAP (120.00 vs 136.67, p = 0.001); lower incidence of changes in body temperature with lesscases of hypothermia or hyperthermia (22.2% vs 39.0%, p = 0.013) and lower body temperature at death (37°C vs 37.8°C, p = 0.001); altered lactate levels > 1.8 mmol/L (83.8% vs 43.7%, p<0.001) with higher lactate value (3.9 mmol/l vs 1.6 mmol/l, p <0.001); altered PCT value ≥ 0.5 pg/ml (88.7% vs 76.8%, p = 0.028) with higher PCT (3 pg/ml vs 2, p = 0.038); altered plasmatic creatinine value ≥ 1.2 mg/dl (74% vs 56.5%, p = 0.007) with higher creatinine (2.0 mg/dl vs 1.3 mg/dl, p <0.001); altered plasmatic bilirubin ≥ 1.2 mg/dl (32.6% vs 18.6%, p = 0.038) with higher bilirubin (0.96 mg/dl vs 0.59 mg/dl, p = 0.005); positive qSOFA criteria (56.7% vs 19.3%, p = <0.001); higher SOFA score (6.0 vs 4.0, p <0.001); altered shock index ≥ 0.7 (81.2% vs 67.8%, p = 0.031) with higher values (0.98 vs 0.77, p <0.001) and altered MEWS ≥ 5 (46.1% vs 17.9%, p <0.001) with higher values (4 vs 2, p <0.001).
To evaluate the strength of the association of variables and clinical indicators with overall mortality a bivariate statistic was tested, results are summarized in Table 3.
 

Variables

OR

CI 95%

p value

Male sex

0.760

0.455 – 1.271

0.296

Age

1.026

1.002 – 1.050

0.031

End-stage renal failure

0.793

0.168 – 3.749

0.770

Cardiovascular diseases

1.463

0.877 – 2.438

0.145

COPD

1.611

0.796 – 3.258

0.185

Diabetes

0.918

0.506 – 1.664

0.777

Chronic Liver diseases

0.407

0.092 – 1.802

0.236

Immunodepression /

immunosuppression

1.276

0.571 – 2.853

0.553

Tumors

0.487

0.229 – 1.035

0.061

Previous Corticosteroid treatments

1.783

0.966 – 3.291

0.064

Previous trauma exposure

0.787

0.258 – 2.399

0.674

Previous surgery

1.006

0.418 – 2.425

0.989

CVC 

1.326

0.613 – 2.868

0.474

Bladder catheter

1.509

0.793 – 2.872

0.210

Prostheses

0.538

0.243 – 1.191

0.126

Hypotension

2.481

1.436 – 4.286

0.001

Hypothermia or Hyperthermia

0.448

0.235 – 0.854

0.015

Leukocytosis or leukopenia

1.434

0.81 – 2.537

0.216

qSOFA criteria

5.487

3.082 – 9.769

<0.001

SIRS criteria 

1.653

0.930 – 2.939

0.087

CCI

0.998

0.895 – 1.113

0.968

SOFA score

1.467

1.316 – 1.636

<0.001

GCS 

0.804

0.753 – 0.858

<0.001

MAP

0.986

0.977 – 0.995

0.002

Body Temperature

0.660

0.517 – 0.844

0.001

Lactate value

1.364

1.224 – 1.519

<0.001

WBC

1.036

1.011 – 1.062

0.005

PCT

1.005

0.996 – 1.014

0.310

Creatinine value

1.325

1.14 – 1.541

<0.001

Bilirubin value

1.433

1.105 – 1.858

0.007

Platelets

1.000

0.998 – 1.002

0.919

MEWS 

1.333

1.205 – 1.475

<0.001

Shock index

6.582

2.793 – 15.514

<0.001

 
Table 3 – Bivariate statistic to evaluate the strength of the association with overall mortality
  
Strongest associations with mortality were shown by shock index (OR 6.582, CI95%2.793-15.514, p <0.001) and (by) qSOFA (OR 5.487, CI95%3.082 – 9.769, p <0.001), followed by hypotension defined as systolic pressure less than 100 mmHg (OR 2.481, CI95%1.436-4.286, p = 0.001). Higher body temperature (OR 0.660, CI95% 0.517-0.844, p = 0.001), as well as the presence of hypothermia or hyperthermia (OR 0.448, CI95% 0.235 – 0.854, p = 0.015), seem to be protective against mortality. Higher age (OR 1.026, CI95% 1.002 – 1.050, p = 0.031), SOFA score (OR 1.467, CI95% 1.316 – 1.636, p <0.001), lactate value (OR 1.364, CI95% 1.224 – 1.519, p <0.001), WBC count (OR 1.036, CI95% 1.011 – 1.062, p = 0.005), creatinine value (OR 1.325, CI95% 1.14 – 1.541, p <0.001), bilirubin value (OR 1.433, CI95% 1.105 – 1.858, p = 0.007) and MEWS (OR 1.333, CI95% 1.205 – 1.475, p <0.001) were associated to higher risk of death. Instead, higher GCS (OR 0.804, CI95% 0.753 – 0.858, p <0.001) and MAP (OR 0.986, CI95% 0.977 – 0.995, p = 0.002) were associated to lower risk for mortality.
To find out which clinical indicators could be quickly and easily used already in triage to identify patients with infection at risk of death, a ROC curve was built (Figure 1) and related data on Area under the Receiver Operating Characteristics – AUROC – are summarized in Table 4.
Table 4 – Statistical data of ROC curve between Lactate, Hypotension and severity scores in predicting overall mortality
  
We have chosen to test only those variables and clinical indicators that can be used in a few minutes during triage phase, such as qSOFA, lactate value, MEWS, Shock Index and hypotension, defined as systolic pressure less than 100 mmHg: the most performing result (AUROC values of 0.70 and higher) was that of lactate values (Sensitivity 81%, Specificity 59.5%, PPV 34.4%, NPV 92.7%), followed by MEWS (Sensitivity 72.4%, Specificity 56.6%, PPV 32.9%, NPV 89.2%) and shock index (Sensitivity 81%, Specificity 50.2%, PPV 30.5%, NPV 88%).

Discussion and Conclusion

Past scientific experiences of old sepsis definitions had already shown that when sepsis is identified early in the ED, and its severe form is treated aggressively with sepsis specificcare bundle, improvements in mortality are significant1,11,12
New Guidelines of the Surviving Sepsis Campaign 2016 have renounced to propose rigid haemodynamic management schemes of sepsis, accepting simpler management protocols based mainly on clinical tools. The new definition of sepsis, which abandoned the criteria related to SIRS, proposed the SOFA score as a diagnostic criteria and the qSOFA for early recognition4. This choice has caused a wide debate, with some societies that have not endorsed the sepsis 3 protocol, such as IDSA, and the discussion isstill ongoing, on the validity ofthesenew criteria when compared to previous ones in terms of sensitivity and specificity.
Currently, despite the uncertainty related to the choice of the best systems of early recognition and hemodynamic management, fundamental actions able to reduce mortality related to sepsis are: rapid recognition and management protocols in ED including blood cultures, liquid replacement, and early empiric antibiotic therapy13,14.
The Surviving Sepsis Campaign (SSC) Hour-1 bundle encourages clinicians to act as quickly as possible to obtain blood cultures prior to empiric antibiotic therapy and administer broad spectrum antibiotics;beyond that, tostart appropriate fluid resuscitation, measure lactate, and begin vasopressors if clinically indicated15.
Our data show that fluid resuscitation was globally undertaken in 87% of cases (303/349) and empirical antibiotic therapy in 73% of cases (249/343) and in 95% of cases (236/249) as monotherapy. Unfortunately, a set of blood cultures was collected in 128/314 patients (41%), and among these in 71% of cases blood cultures were not collected prior to the administration of empiric antibiotic therapy.
Collecting microbiological cultures before administration of antibiotics increasesthe probability to isolate the microorganism responsible for sepsis16,17 whiletimely administration of appropriate antibiotic therapy after collecting blood cultures isessential for effective treatment and reduces mortality14,18,19.
In this study, 95% of cases enrolled were hospitalized with a median length of hospital stay of 7 days, while 14 patients died directly in ED (4%). Overall mortality was 22% and in-hospital mortality was 19%, higher in cases with sepsis and septic shock when compared with infected patients (respectively 24% vs 7%, p = 0.009, 21% vs 8%, p = 0.042). 
In order to improve the management of patients whit sepsis or septic shock admitted to ED we should establish risk groups of poor prognosis. 
Our data shown that patients at risk to die are older (84 years vs 79 years, p = 0.013), data confirmed in the multivariate analysis (OR 1.026, CI95% 1.002 -1.050, p = 0.031). 
It is interesting to note that higher body temperature (OR 0.660, CI95% 0.517-0.844, p = 0.001), as well as the presence of hypothermia or hyperthermia (OR 0.448, CI95% 0.235 – 0.854, p = 0.015), seemsto be protective againstmortality. Probably, the presence of a body temperature strongalteration makesclinical diagnosis of septic cases easier thannormothermia.
Strongest associations with mortality at multivariate analysis were shown by shock index (OR 6.582, CI95% 2.793-15.514, p <0.001) and by qSOFA (OR 5.487, CI95% 3.082 – 9.769, p <0.001), followed by hypotension defined as systolic pressure less than 100 mmHg (OR 2.481, CI95% 1.436 – 4.286, p = 0.001). 
To identify which clinical indicators could be quickly and easily used already in triage for patients with infection at risk of death, a ROC curve was built with only those variables and clinical indicators that can be used in a few minutes during triage phase, such as qSOFA, lactate value, MEWS, Shock Index and hypotension, defined as systolic pressure less than 100 mmHg. Shock index is an effective, no-cost modality in the initial assessment of patients at risk for sepsis which may be used as a “red flag” for severe disease; this is particularly useful when traditional vital signs are seemingly relatively benign20.
The qSOFA is a quick system to detect multi-organic dysfunctions;  not only it is useful in patients with clinical suspicion of infection, butit isalso  capable of detecting patients with higher chances of having worse prognoses with an AUROC ranking 0.706. Also Freund et al in a prospective study pointed out that qSOFA, compared to the previous diagnostic criteria of sepsis,has a greater prognostic accuracyin predicting mortality7.
In our study, AUROC values of 0.70 and higher were found for lactate values (Sensitivity 81%, Specificity 59.5%, PPV 34.4%, NPV 92.7%), MEWS (Sensitivity 72.4%, Specificity 56.6%, PPV 32.9%, NPV 89.2%) and shock index (Sensitivity 81%, Specificity 50.2%, PPV 30.5%, NPV 88%). It is shown that a bedside lactate level higher than 2mmol/L was associated with a worse outcome in terms of mortality, ICU stay and need for vasopressor21. Recently, Churpeket et al. compared different risk identification systems to the qSOFA score in conventional wards; they established that systems such as the Early Warning Score (EWS) and, particularly, the HEWS score both improve the qSOFA score predicting abilities for all hospitalized patients22
Early Warning Score – EWS – systems allow the creation of task escalation algorithms by the nursing team, the doctors on call, or the rapid response teams, which in turn allows us to improve the monitoring capabilities or management of these higher risk patients23. The prognostic accuracy of EWS for patients presenting to the emergency department (ED) has been confirmed in a wide range of illness severity24,25. The Modified Early Warning Score (MEWS) determines the degree of illness of a patient using 4 physiological findings and one observation, and in this study it has beenproved capable of predicting mortality in septic patients admitted in ED. Data shown in this study are preliminary data from a series of cases still ongoing. Our preliminary analyses have shown that sensitivity performance of all clinical tools used for early diagnosis of triage in ED was sub-optimal. Further analyses and prospective studies should be done to identify those diagnostic tools with optimal performance for the early detection of septic patient in ED.
Having these important premises on the limits related to the results of our study, in our case studies the lactate value, MEWS or shock index more accurately identify patients at risk of mortality due to sepsis, compared to qSOFA.

Conclusions

Sepsis is of great clinical importance, being responsible for more than one third of all hospital admissions, and it is associated with a large economic burden on healthcare. The Third International Consensus Definitions for Sepsis and Septic Shock (Sepsis-3) reviewed and updated sepsis definitions. Sepsis is now defined as a “life-threatening organ dysfunction caused by a dysregulated host response to infection”; organ dysfunction is defined as an increase in SOFA score ≥ 2 but SOFA requires laboratory values which may not be rapidly available. qSOFA was developed to provide an abbreviated version that can easily be performed at the bedside by the non-specialist but the main utility of qSOFA appears to be for the characterization of patients with suspected or known infection, in whom sepsis should be considered, who are at a higher risk of developing a poor outcome, and who may benefit from more frequent observations and targeted interventions.
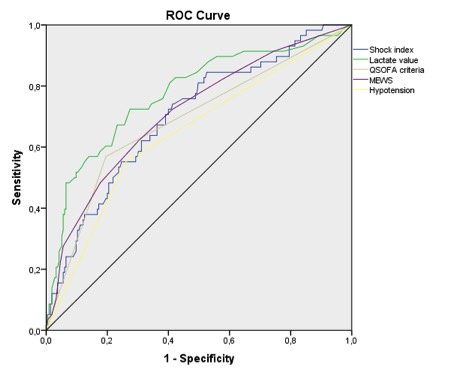
Although all clinical tools used for early diagnosis of triage in ED were sub-optimal, our preliminary analysis showed that lactates value and the use of clinical tools in ED such as EWS (in our case the MEWS) or more simply the shock index, could be used in the triage phase to identify patients at risk of poor prognosis due to sepsis or septic shock. Using these tools as “red flags”, an immediate management could be carried out, after a “few minutes” evaluation during triage phases.

References

  1. Dellinger RP, Levy MM, Rhodes A, et al. Surviving Sepsis Campaign: International Guidelines for Management of Severe Sepsis and Septic Shock 2012. Intensive Care Medicine 2013; 39(2):165-228; Critical Care Medicine 2013; 41:580-637
  2. Geoffrey E, Hayden MD, Rachel E, et al. Triage sepsis alert and sepsis protocol lower times to fluids and antibiotics in the ED. The American Journal of Emergency Medicine 2016; 34(1):1–9
  3. Fleischmann C, Scherag A, Adhikari NKJ, et al. Assessment of Global Incidence and Mortality of Hospital-treated Sepsis. Current Estimates and Limitations. Am J Respir Crit Care Med 2016; 193(3): 259–272
  4. Singer M, Deutschman CS, Seymour CW, et al. The Third International Consensus Definition for Sepsis and Septic Shock (Sepsis-3). Jama 2016; 315 (8): 801-810
  5. Calci M, Ruggiano G, Causin F et al. Simeu Consensus Conference on management of sepsis and septic shock in Emergency Department: preliminary survey results. ITJEM 2018; n°1
  6. Singer AJ, Ng J, Thode HC, et al. Quick SOFA Scores predict mortality in adult emergency department patients with and without suspected infection. Ann Emerg Med 2017; 69(4):475-479
  7. Freund Y, Lemachatti N, Krastinova E, et al. Prognostic Accuracy of Sepsis-3 Criteria for In-Hospital Mortality Among Patients With Suspected Infection Presenting to the Emergency Department. JAMA 2017; 317(3):301-308
  8. Serafim R, Gomes JA, Salluh J, et al. A Comparison of the Quick-SOFA and Systemic Inflammatory Response Syndrome Criteria for the Diagnosis of Sepsis and Prediction of Mortality: A Systematic Review and Meta-Analysis. Chest 2018; 153(3):646-655
  9. Percorso Sepsi. Gestione della Sepsi e dello Shock Settico, Identificazione e Trattamento – Percorso Diagnostico Terapeutico Assistenziale (PDTA). Regione Toscana, Aprile 2016, Delibera n.752 del 10-07-2017 -Allegato A – PROGRAMMA REGIONALE DI LOTTA ALLA SEPSI
  10. Bassetti M, Calci M, Cappello Dario, et al. La sepsi: riconoscimento precoce in Pronto Soccorso e gestione della fase iniziale nell’adulto. Direzione centrale salute, integrazione socio-sanitaria, politiche sociali e famiglia Regione Friuli Venezia Giulia 2017.
  11. Rivers EP, Nguyen HB, Havstad S, et al. Early Goal-Directed Therapy in the Treatment of Severe Sepsis and Septic Shock. N Engl J Med 2001; 345:1368-1377
  12. Osborn TM, Nguyen HB, Rivers EP. Emergency Medicine and the Surviving Sepsis Campaign: An International Approach to Managing Severe Sepsis and Septic Shock. Ann Emerg Med 2005; 46(3):228-231
  13. Daniels R, Nutbeam T, McNamara G, et al. The sepsis six and the severe sepsis resuscitation bundle: a prospective observational cohort study. Emerg Med J2011; 28(6):507-12
  14. Ferrer R, Martin-Loeches I, Phillips G, et al. Empiric Antibiotic Treatment Reduces Mortality in Severe Sepsis and Septic Shock From the First Hour: Results From a Guideline-Based Performance Improvement Program. Crit Care Med 2014; 42(8):1749-1755
  15. Rhodes A, Evans LE, Alhazzani W, et al. Surviving Sepsis Campaign: International Guidelines for Management of Sepsis and Septic Shock: 2016. Intensive Care Medicine 2017;43(3):304-377; Critical Care Medicine 2017; 45(3):486-552
  16. Zadroga R, Williams DN, Gottschall R, et al. Comparison of 2 Blood Culture Media Shows Significant Differences in Bacterial Recovery for Patients on Antimicrobial Therapy. Clin Infect Dis 2013; 56(6):790-797
  17. De Sousa AG, Fernandes Junior CJ, Santos GPD, et al. The impact of each action in the Surviving Sepsis Campaign measures on hospital mortality of patients with severe sepsis/septic shock. Einstein 2008; 6(3):323-327
  18. Kumar A, Ellis P, Arabi Y, et al. Initiation of Inappropriate Antimicrobial Therapy Results in a Fivefold Reduction of Survival in Human Septic Shock. Chest 2009; 136(5):1237-1248
  19. Gaieski DF, Mikkelsen ME, Band RA, et al. Impact of time to antibiotics on survival in patients with severe sepsis or septic shock in whom early goal-directed therapy was initiated in the emergency department. Crit Care Med 2010; 38(4):1045-1053
  20. Subbe CP, Kruger M, Rutherford P, et al. Validation of a modified Early Warning Score in medical admissions. QJM 2001; 94(10):521-526 
  21. Singer AJ, Taylor M, Domingo A, et al. Diagnostic characteristics of a Clinical Screening Tool in Combination With Measuring Bedside Lactate Level in Emergency Department Patients With Suspected Sepsis. Acad Emerg Med 2014; 21(8):853-857
  22. Churpek MM, Snyder A, Han X, et al. Quick Sepsis-related Organ Failure Assessment, Systemic Inflammatory Response Syndrome, and Early Warning Scores for Detecting Clinical Deterioration in Infected Patients outside the Intensive Care Unit. Am J Respir Crit Care Med 2017; 195(7):906-911
  23. Gordo VF, Molina R. Evolución a la detección precoz de gravedad. ¿Hacia dónde vamos?. Med Intensiva 2017; 42(1):47–49
  24. Abbott TEF, Vaid N, Ip D, et al. A single-centre observational cohort study of admission National Early Warning Score (NEWS). Resuscitation 2015; 92:89–93 
  25. Corfield AR, Lees F, Zealley I, et al. Utility of a single early warning score in patients with sepsis in the emergency department. Emerg Med J 2014; 31(6):482–487